
When your metrics start managing you.
Why hitting your targets might mean you're losing.

Quick favor before we dive in: I’m launching my first mobile app (goal: get something in an app store by end of 2025 - almost there!). It’s a simple tool to help you research your next book to read. No data collection, no ads.
Android requires 12 testers for closed testing. Want to help? Fill out this quick form with your email so I can send you a link. Thank you, thank you, thank you!
Now on to the good stuff.
You’re in a meeting and someone asks the question that makes your stomach drop: “What’s our number?” Not “Are we solving the right problems?” or “What are customers telling us?” Just: what’s the number.
I’ve been in that room. The one where a VP stares at a dashboard showing 92% customer satisfaction and asks why it’s not 95%. Where engineering velocity is measured in story points per sprint, regardless of whether those stories matter. Where your quarterly review hinges on hitting targets that stopped reflecting reality six months ago.
The moment you start optimizing for the measurement instead of the outcome, you’ve lost the plot. And it happens so gradually, you don’t notice until you’re deep in it.

Pattern recognition: how good intentions go sideways.
Let me show you what metric dysfunction looks like in the wild, because once you recognize it, you can’t unsee it.
Wells Fargo wanted engaged customers, so they measured account depth. Reasonable proxy, right? More accounts means more engagement.
Except employees opened 3.5 million fake accounts to hit their targets.
The metric didn’t just fail - it destroyed the thing it was supposed to measure: customer trust. Cost them $3 billion in settlements.
Microsoft used stack ranking to identify top performers. Forced distribution, clear metrics, objective evaluation. What they got was employees competing with each other instead of with competitors.
Teams stopped collaborating. Innovation stalled. They lost a decade.
VA hospitals were measured on 14-day appointment targets. When real wait times stretched beyond that, administrators created secret waiting lists.
At least 40 veterans died while stuck on lists that didn’t officially exist. The metric meant to ensure care actually prevented it.
I’m not sharing these to say metrics are bad. I’m sharing them because they follow a predictable sequence:
You identify something important (customer engagement, performance, timely care).
You create a measurement proxy for it.
That proxy becomes a target.
People optimize for the target instead of the outcome.
The measurement stops being meaningful.
Economists call this Goodhart’s Law: when a measure becomes a target, it ceases to be a good measure. Knowing the name doesn’t help you in that meeting when someone’s asking about your number.
What helps is having a better approach.

Your Measurement Playbook: Five principles that hold up under pressure.
This is the section I want you to remember. Not the cautionary tales, but the practical approach you can take into your next stakeholder conversation.
1. Start with Outcomes, Build Metrics Backward
Instead of asking “What can we measure?” ask “What outcome would prove we’re succeeding?” Then work backward to find leading indicators of that outcome.
Amazon doesn’t measure “features shipped” because that’s an output. They measure “customer problems solved” and “repeat purchase behavior” because those are outcomes that predict business success. When you’re defending a product direction, show stakeholders the outcome first, then explain how your proposed metrics will indicate progress toward it.
Your talking point: “We could measure [easy metric], but that would tell us we’re busy, not that we’re effective. What we actually care about is [outcome]. Here’s how we’ll know we’re getting there.”
2. Use Multiple, Complementary Metrics
No single number captures reality. The best measurement systems use 3-5 metrics that balance each other and prevent gaming.
My go-to structure:
One North Star metric that indicates long-term value (like Spotify’s “time spent listening”)
Two leading indicators that predict the North Star (like “daily active users” and “content satisfaction”)
One quality metric that prevents you from destroying value while chasing growth (like “completion rate” or “support ticket volume”)
One efficiency metric so you’re not building the right thing the wrong way (like “cycle time” or “cost per acquisition”)
Your stakeholder pitch: “If we only measure [single metric], we’ll be blind to [specific risk]. This balanced set tells us whether we’re creating sustainable value, not just hitting a number.”
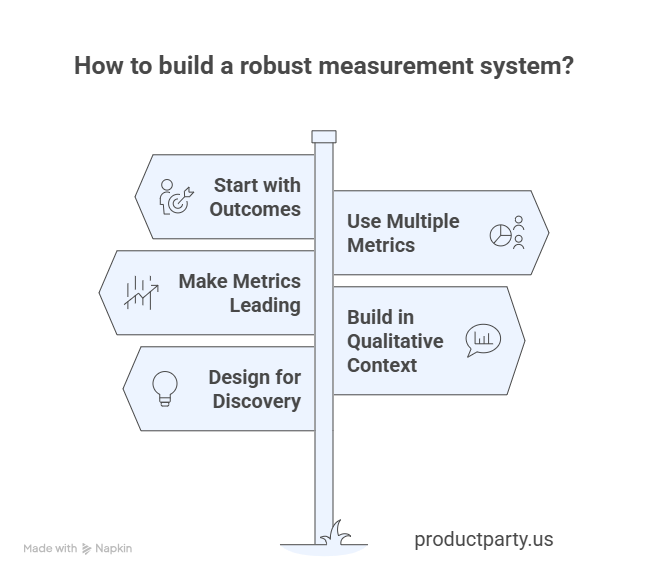
3. Make Metrics Leading, Not Lagging
Lagging indicators tell you what already happened. Leading indicators tell you what’s about to happen, while you still have time to adjust.
Netflix doesn’t just track subscribers (lagging). They track viewing completion rates for new content in the first 48 hours (leading), because that predicts both retention and word-of-mouth growth. It gives them weeks of advance notice on whether they have a hit or a miss.
To identify leading metrics, ask yourself: “If this number moves, what does it predict about our North Star three months from now?” If the answer is “nothing,” it’s not leading.
Your defense to stakeholders: “This metric might not be moving yet, but it’s telling us about momentum we’ll see next quarter. Here’s the pattern from [similar situation].”
4. Build in Qualitative Context
The healthiest teams I’ve worked with never look at quantitative metrics in isolation. They pair every number with qualitative insight about why it’s moving.
For every metric review, include:
The number and its trend
Three customer quotes or stories that explain what’s behind the trend
One hypothesis about what would improve it
One thing you learned from customers this week that the metrics can’t capture
Your stakeholder conversation: “Here’s what the numbers show. Here’s what customers are actually saying. There’s a gap between those two things, and that gap is where the real insight lives.”
5. Design for Discovery, Not Just Validation
The most valuable metrics are the ones that surprise you and reveal something you didn’t know. If your dashboard only confirms what you already believe, it’s not helping you learn.
Ask: “What would this metric tell us that would completely change our strategy?” If the answer is “nothing,” you’re measuring for reporting, not learning.
For stakeholders: Present metrics as hypotheses you’re testing, not truths you’re confirming. “We believe X will drive Y, and here’s how we’ll know if we’re wrong.”

The objection-handling cheat sheet.
Most product people struggle not with understanding better measurement, but with defending it when someone wants their clean, simple, single number. Here are some additional examples you could use for handling objections when you are having these conversations.
When someone asks, “What’s our number?” respond with:
“That depends on what you’re trying to understand. Are you asking about short-term momentum or long-term health? Because I can show you both, but they tell different stories.”
When someone says, “We need to hit 95%” ask:
“What changes for us at 95% versus 92%? If the answer is ‘nothing material,’ let’s talk about what threshold actually matters and why.”
When someone wants to add another metric, say:
“I’m worried about measurement overload. Before we add that, what would we stop measuring? Or what decision will this metric help us make that we can’t make now?”
When someone questions why you’re not measuring something obvious, explain:
“We could measure that, but here’s what happens when we turn that into a target…” [Insert relevant cautionary example from earlier].
There are a million scenarios you could run into - you can’t script them all, but this mindset works in each.
Stay curious, not defensive. You’re not saying no to measurement - you’re offering a more useful way to measure.

Your litmus test for any metric.
Run this test on every metric you’re considering: “If this number goes up, am I certain that’s good for our customers and our business?”
If you can’t answer “yes” without caveats, you’ve got the wrong metric.
Daily active users can go up because you’re nagging users, not because you’re valuable. Revenue can go up while customer satisfaction craters. Velocity can go up while code quality collapses.
The best metrics pass the “if this, then definitely that” test. If customer problem resolution time drops, that’s definitely good. If retention rate increases, that’s definitely good. If users voluntarily come back to your product daily, that’s definitely good.
Everything else deserves skepticism.
Your measurement audit for this week.
Look at the three metrics you’re currently tracking. For each one, ask:
Does this measure an outcome or just an output? Outputs are what you produce. Outcomes are what change for customers.
If we optimized hard for this metric, what would break? That’s your blind spot.
What would this metric miss if customers were unhappy? If it could miss that, you need a balancing metric.
Can someone game this without providing real value? If yes, you’re measuring the wrong thing.
Would I bet my career on this number going up, meaning we’re succeeding? If not, why are you betting your quarter on it?
Metrics should illuminate your path forward, not become the path itself. Teams that win aren’t the ones with the best dashboards - they’re the ones who remember that numbers serve strategy, not the other way around.
Your competitive advantage isn’t having more metrics than your competitors. It’s having the discipline to measure what matters and the courage to ignore everything else.
Until next week,
Want to connect? Send me a message on LinkedIn, Bluesky, Threads, or Instagram.
P.S. Are you a founder looking for some direction on what to build next? Check out Product Party - The Founder Starter Pack. It’s free and perfect for first-time founders who want frameworks over philosophy, evidence over gut feelings, and practical templates over theoretical advice.
P.P.S. ElevenLabs converts docs to audio so I can actually get through research instead of bookmarking it to die in a tab graveyard. Free tier’s generous. Worth testing if listening beats reading for your brain.

Hey Mike, thank you for the article. This is rather selfish of me, but I'm fresh out of college and working on a tool to streamline code documentation. I would love your advice on what to focus on as I try to get off the ground. Would you be willing to talk or answer a few more specific questions about this post? hjconstas@docforge.net
Really valuable framework for avoiding metric dysfunction. The Wells Fargo example shows how operational incentives can create financial risk - TCLM explores similar dynamics in trade credit and working capital management, where the wrong metrics can quietly drain cash flow while everything looks good on paper. Might be useful alongside your measurement playbook.
(It’s free)- https://tradecredit.substack.com/